OpenTelemetry Integration
Diffy + Observability
The data produced by Diffy can provide valuable insights and make them easily accessible within your existing observability infrastructure. OpenTelemetry provides a standardized mechanism for Diffy to leverage your observability stack to provide useful logs, metrics, and traces.
Diffy's bundled docker-compose script gives you a taste of these capabilities by leveraging:
- Grafana for visualization
- Loki for logs
- Prometheus for metrics
- Tempo and Jaeger for tracing (you only need one but this example shows you both)
Run docker-compose up with this docker-compose.yml configuration and then send some traffic to your deployed topology:
curl -s -i -H Canonical-Resource : endpoint-test http://localhost:8880/success?value=happy-tester
curl -s -i -H Canonical-Resource : endpoint-test http://localhost:8880/noise?value=happy-tester
curl -s -i -H Canonical-Resource : endpoint-test http://localhost:8880/regression?value=happy-tester
curl -s -i -H Canonical-Resource : endpoint-test http://localhost:8880/noisy_regression?value=happy-tester
You can now access live results as follows:
- Diffy
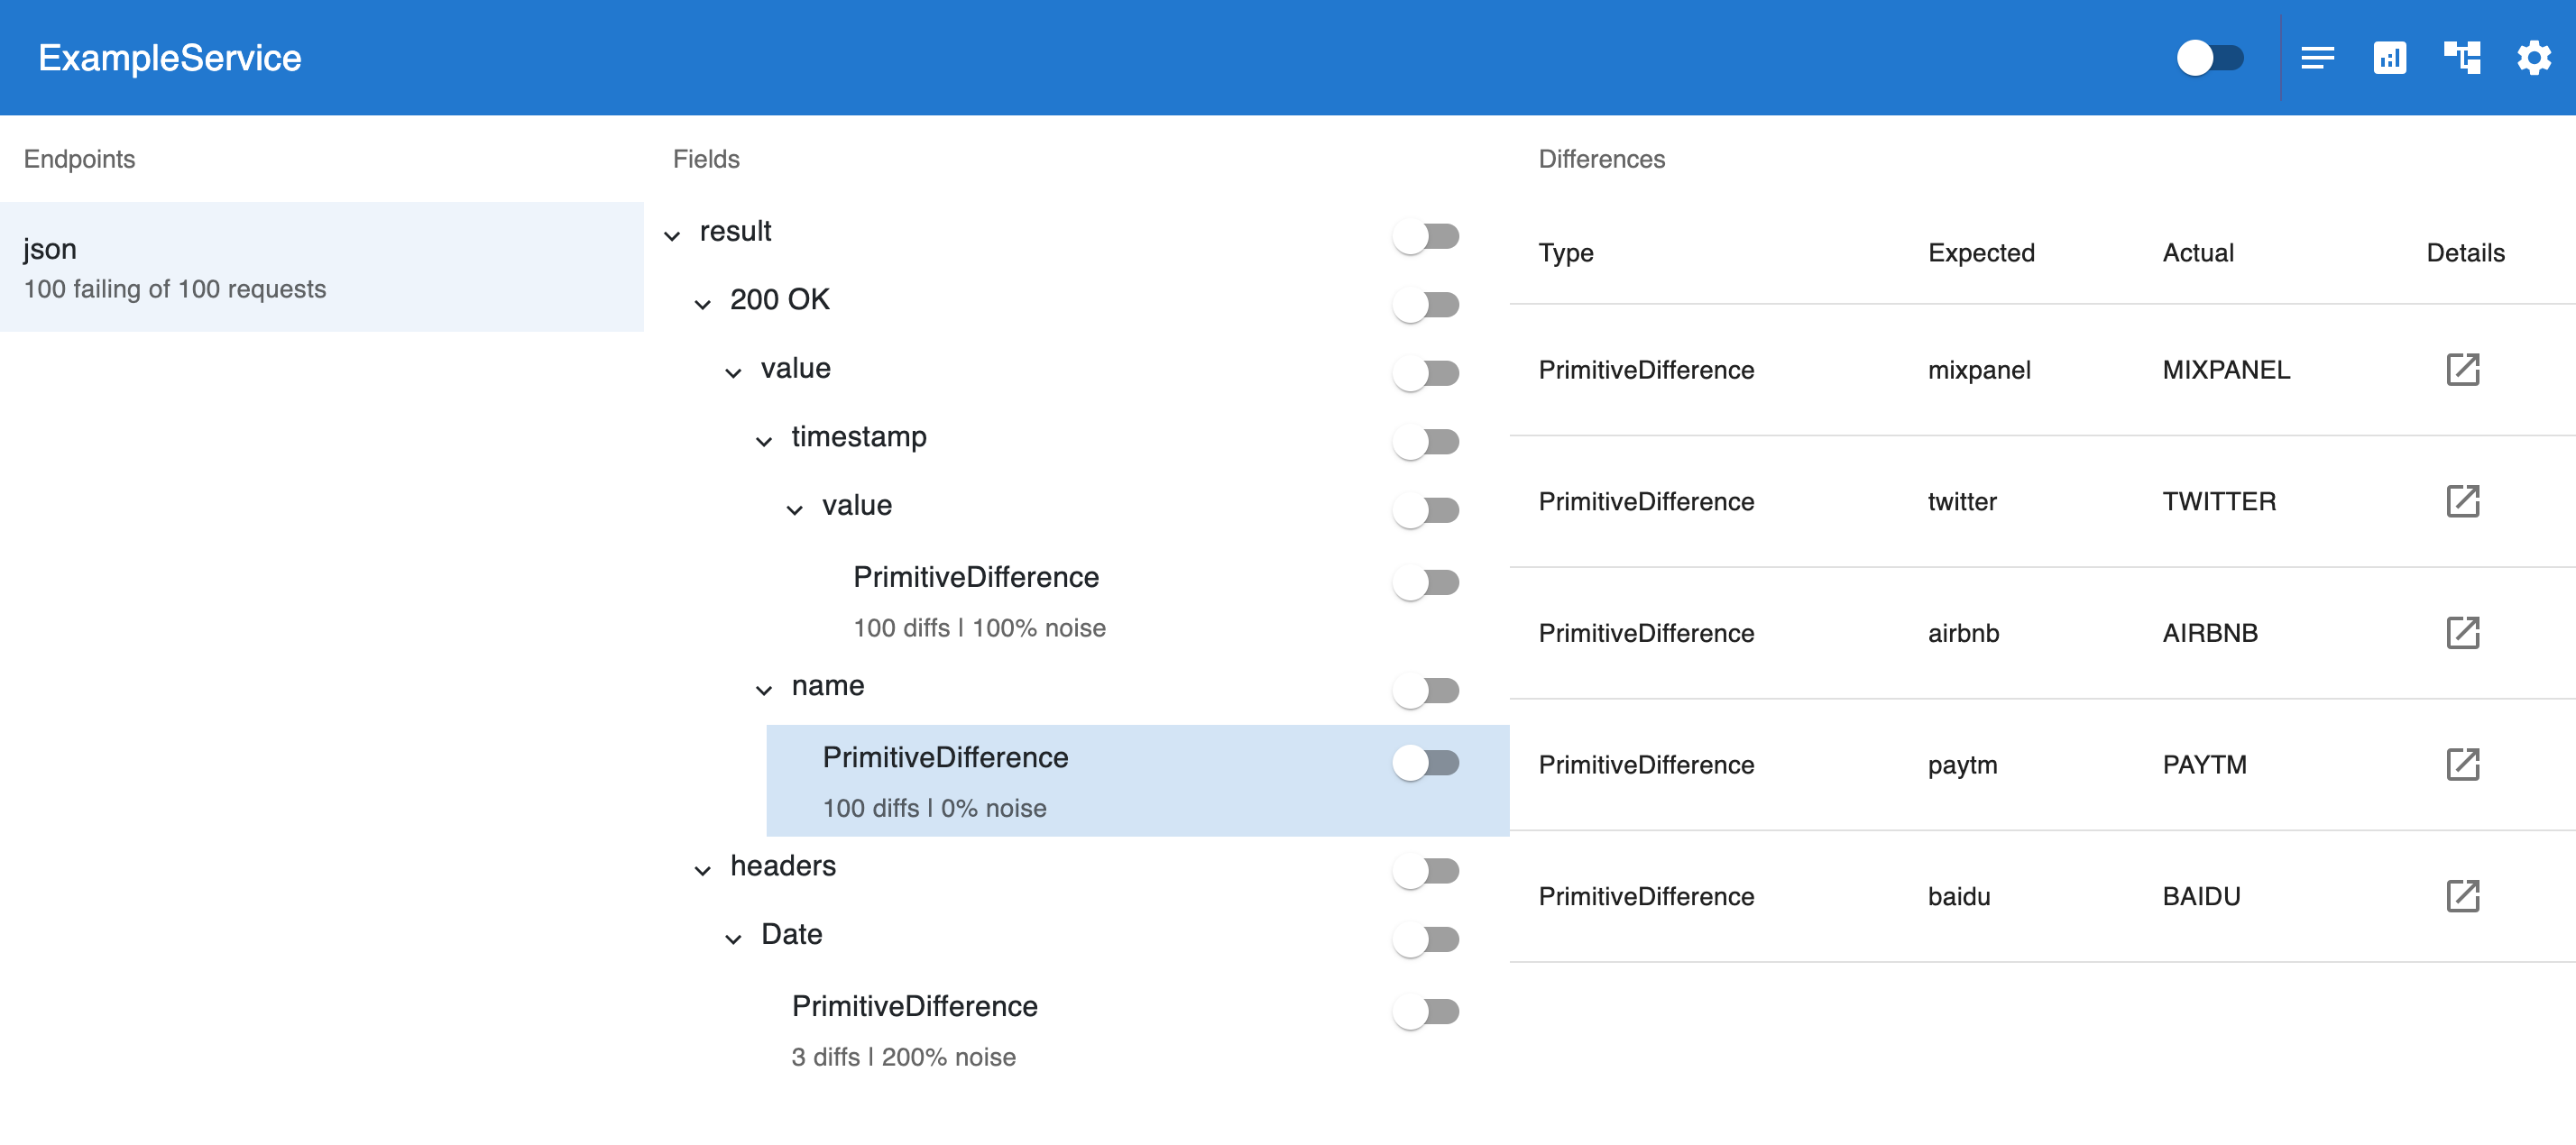
- Grafana Dashboards
- Loki (logs)
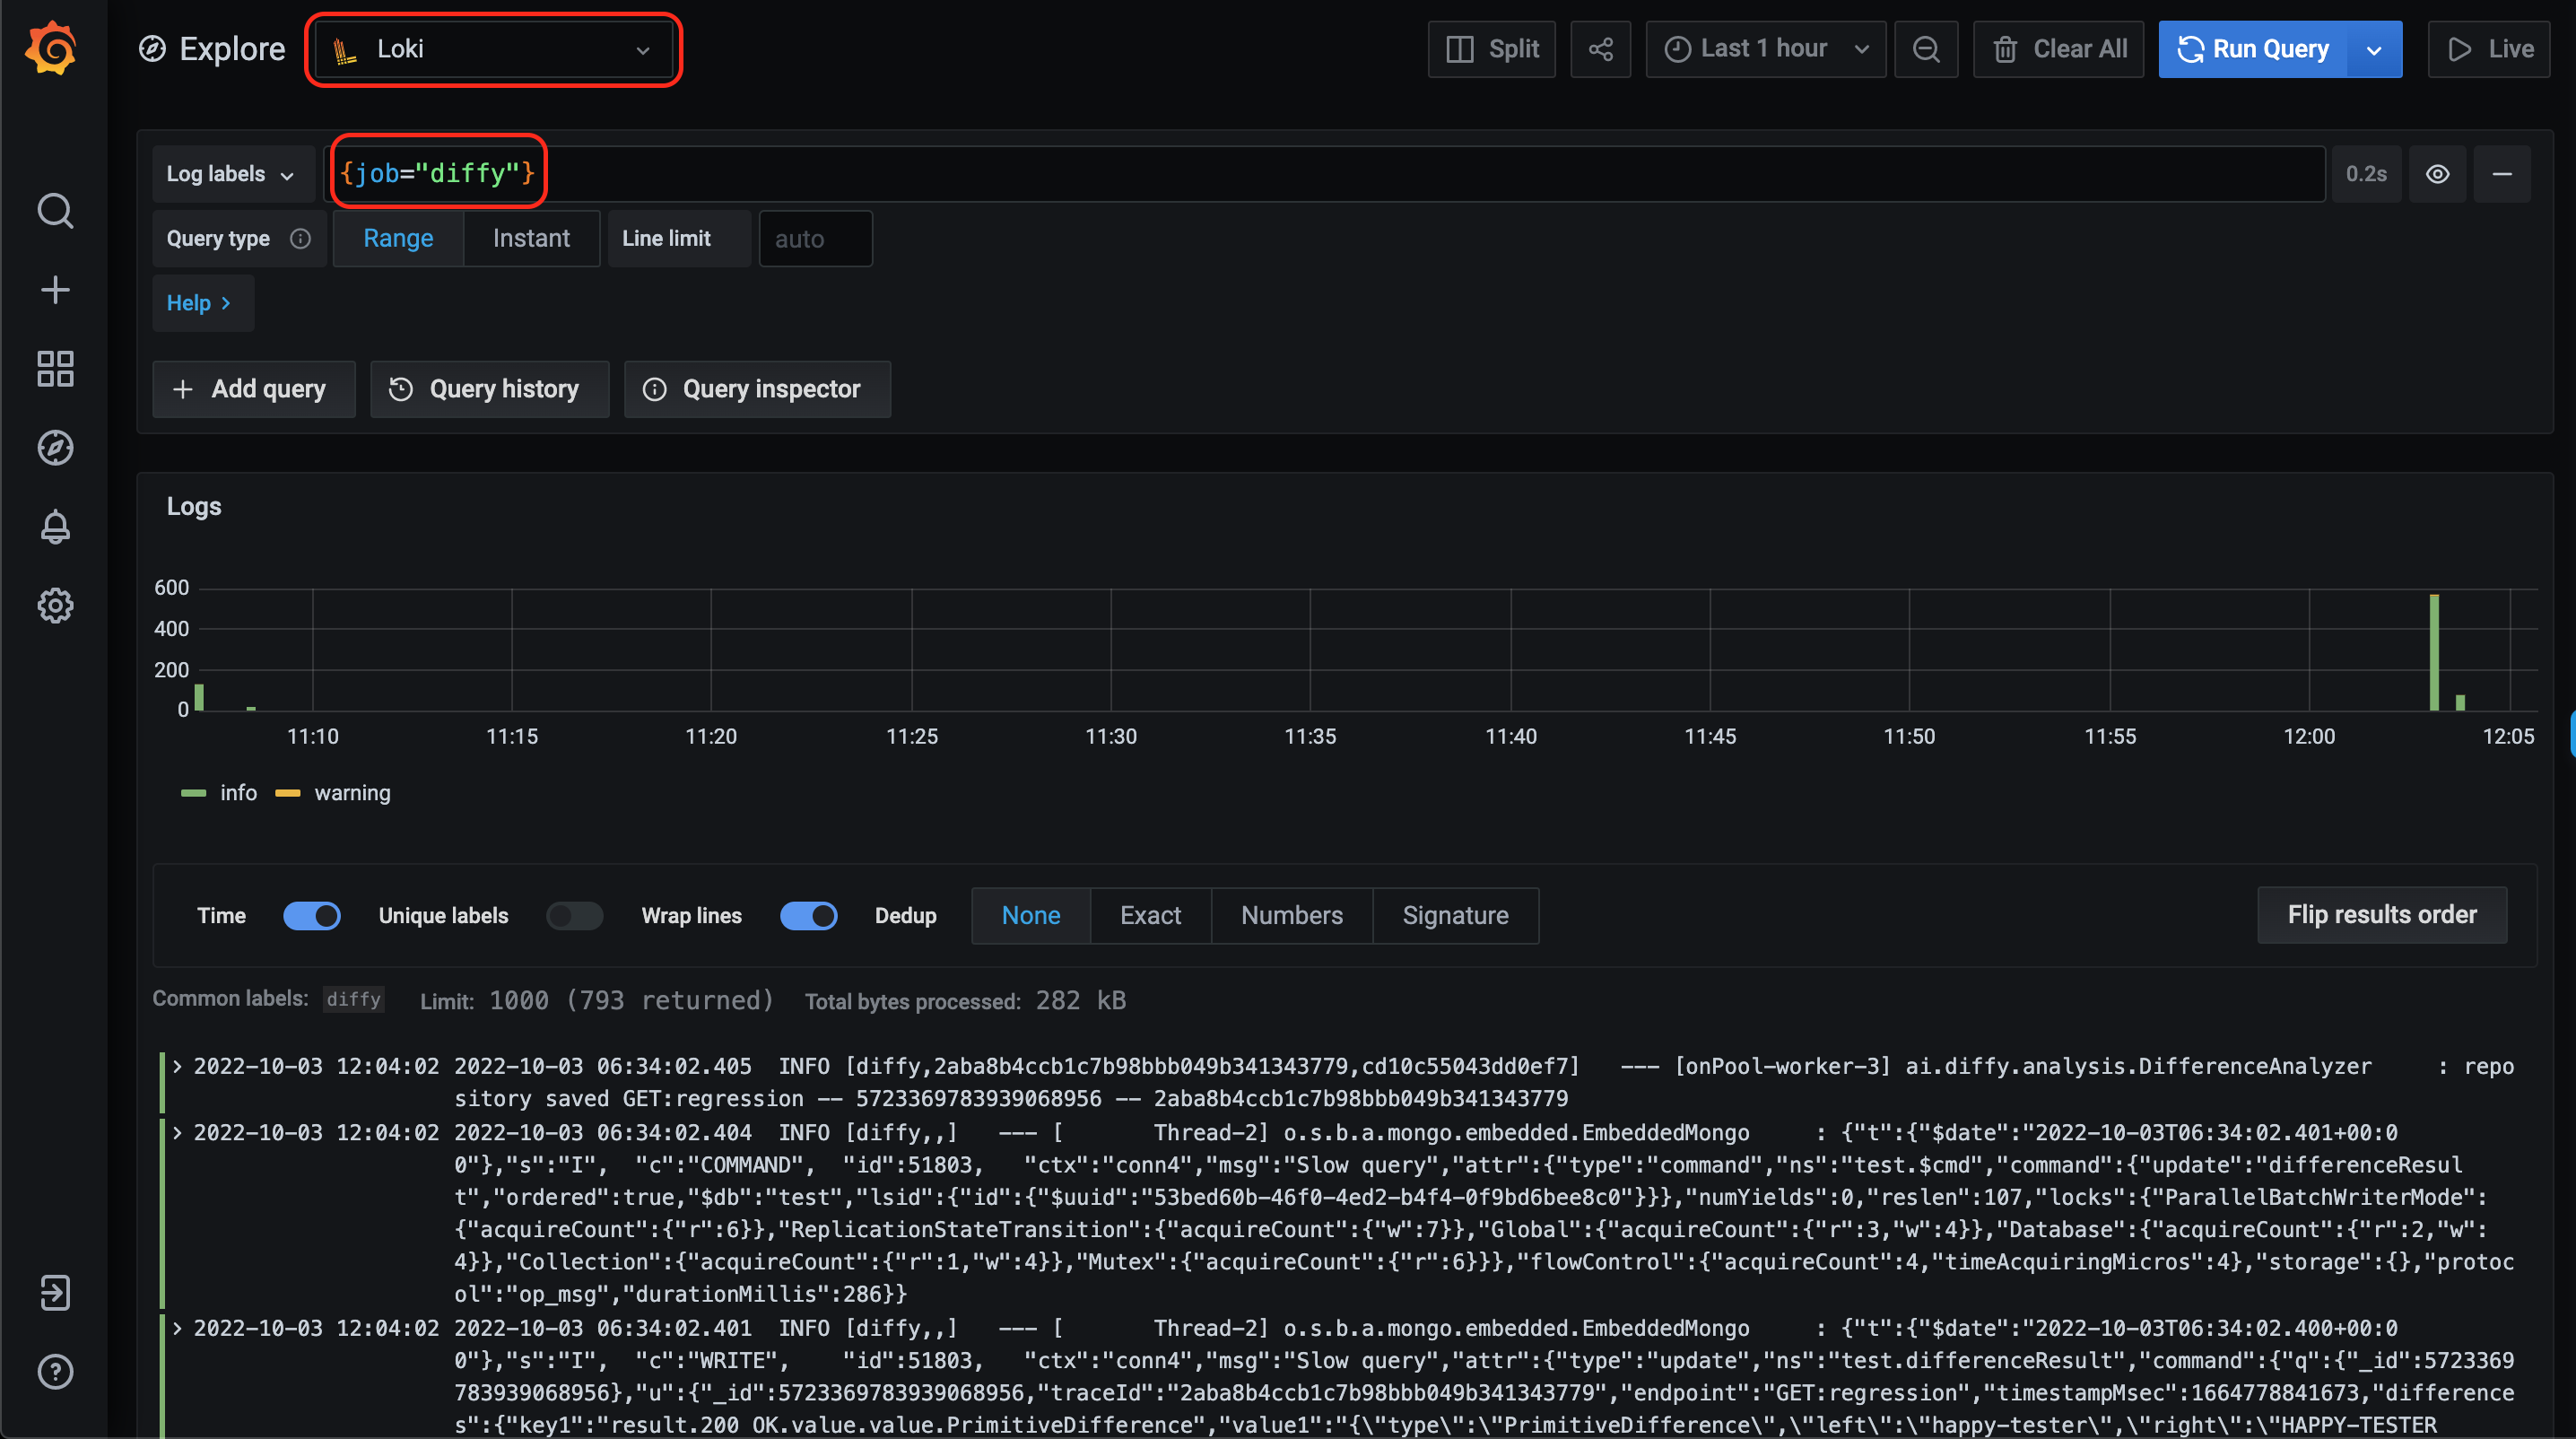
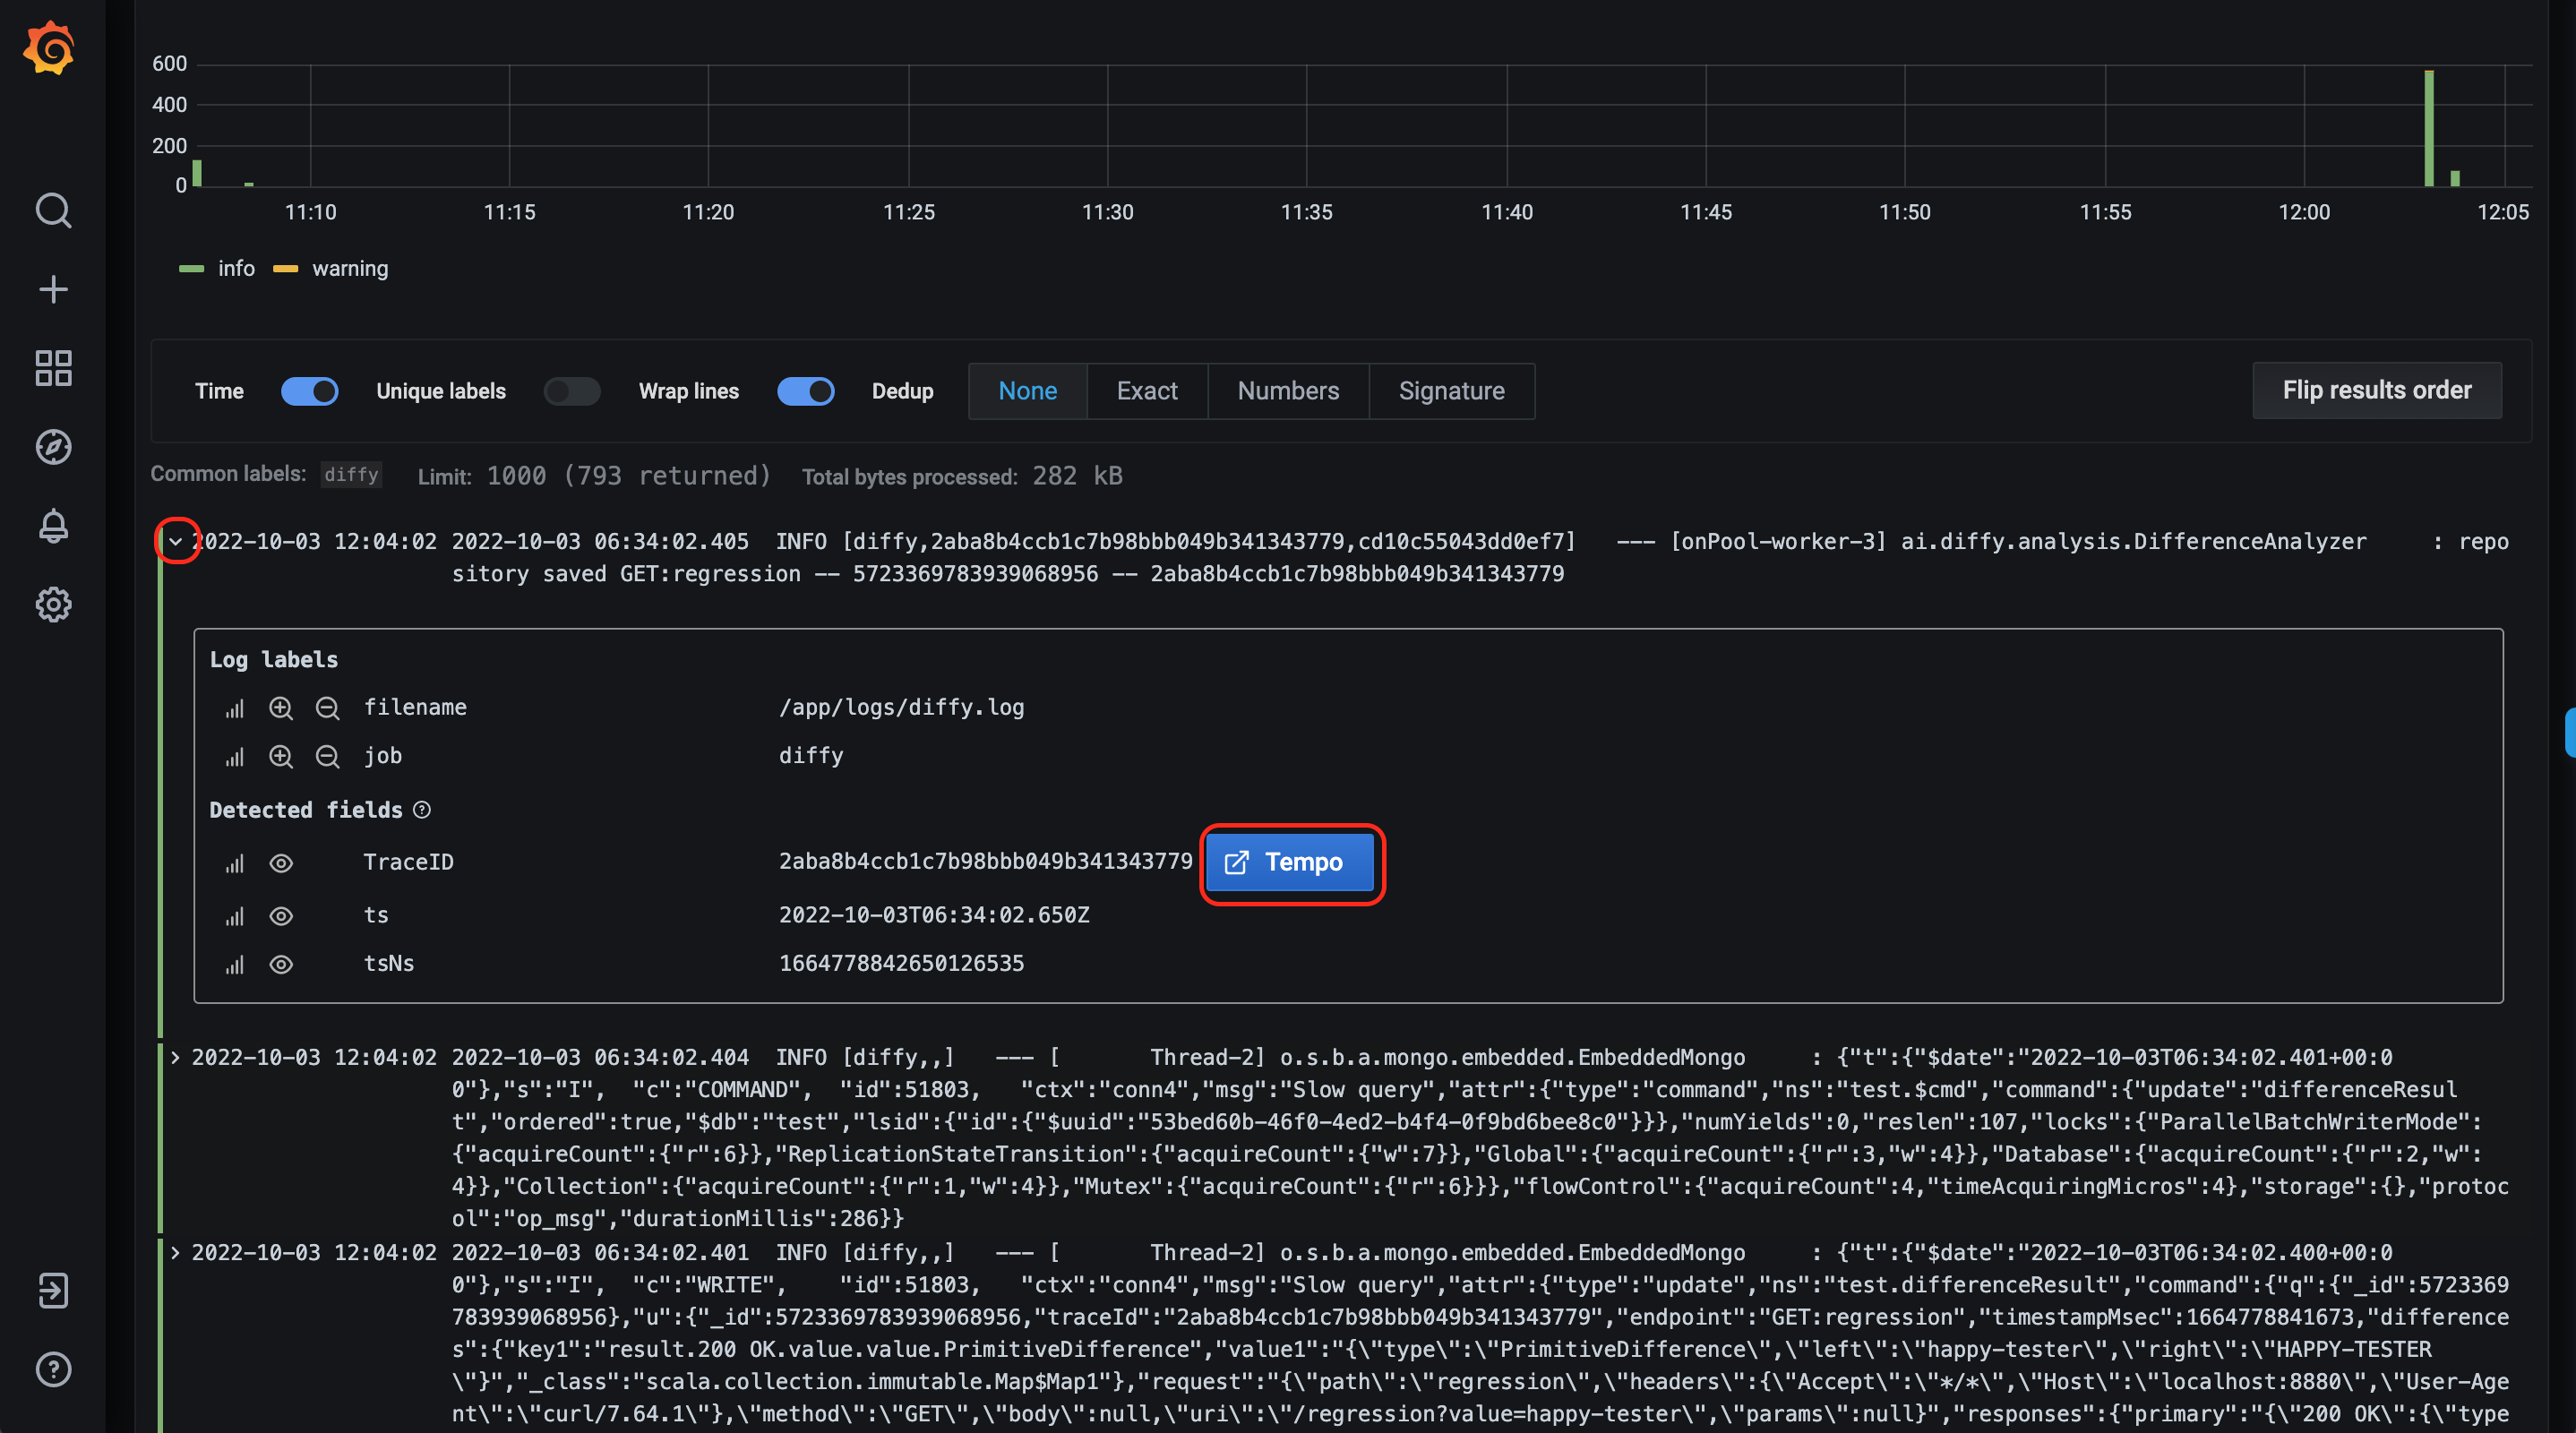
- Tempo (tracing)
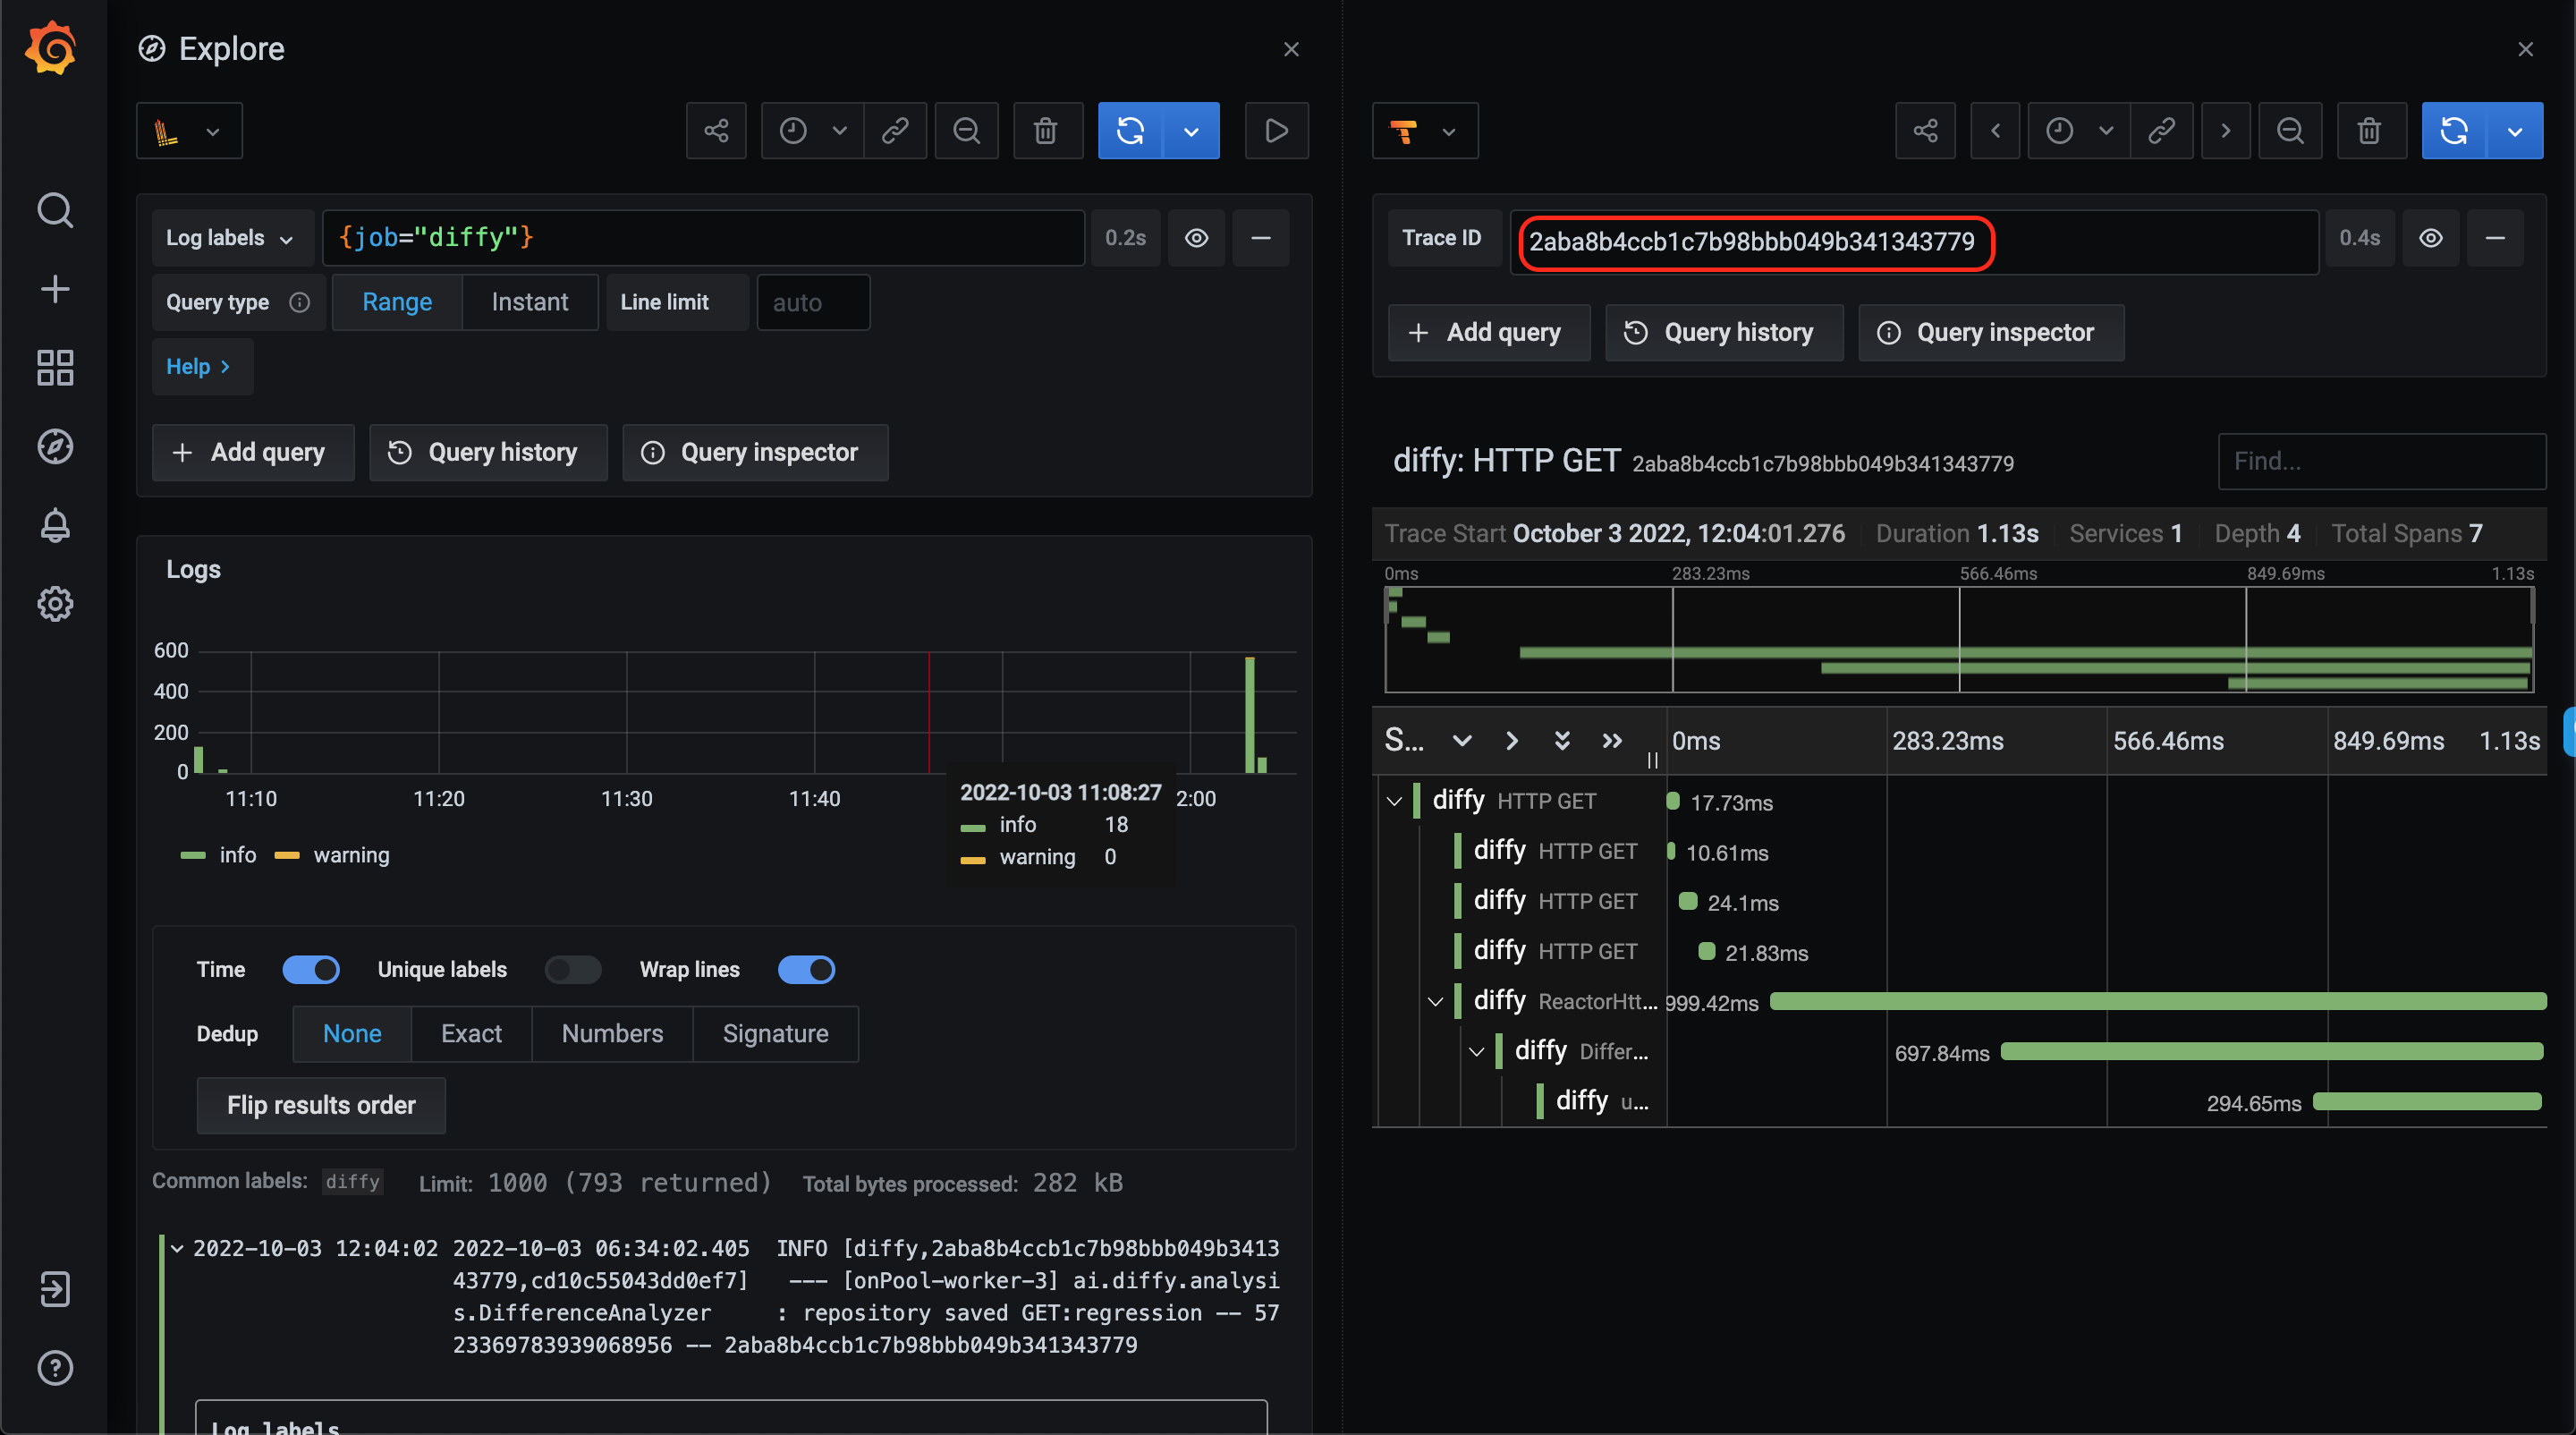
- Prometheus (metrics)
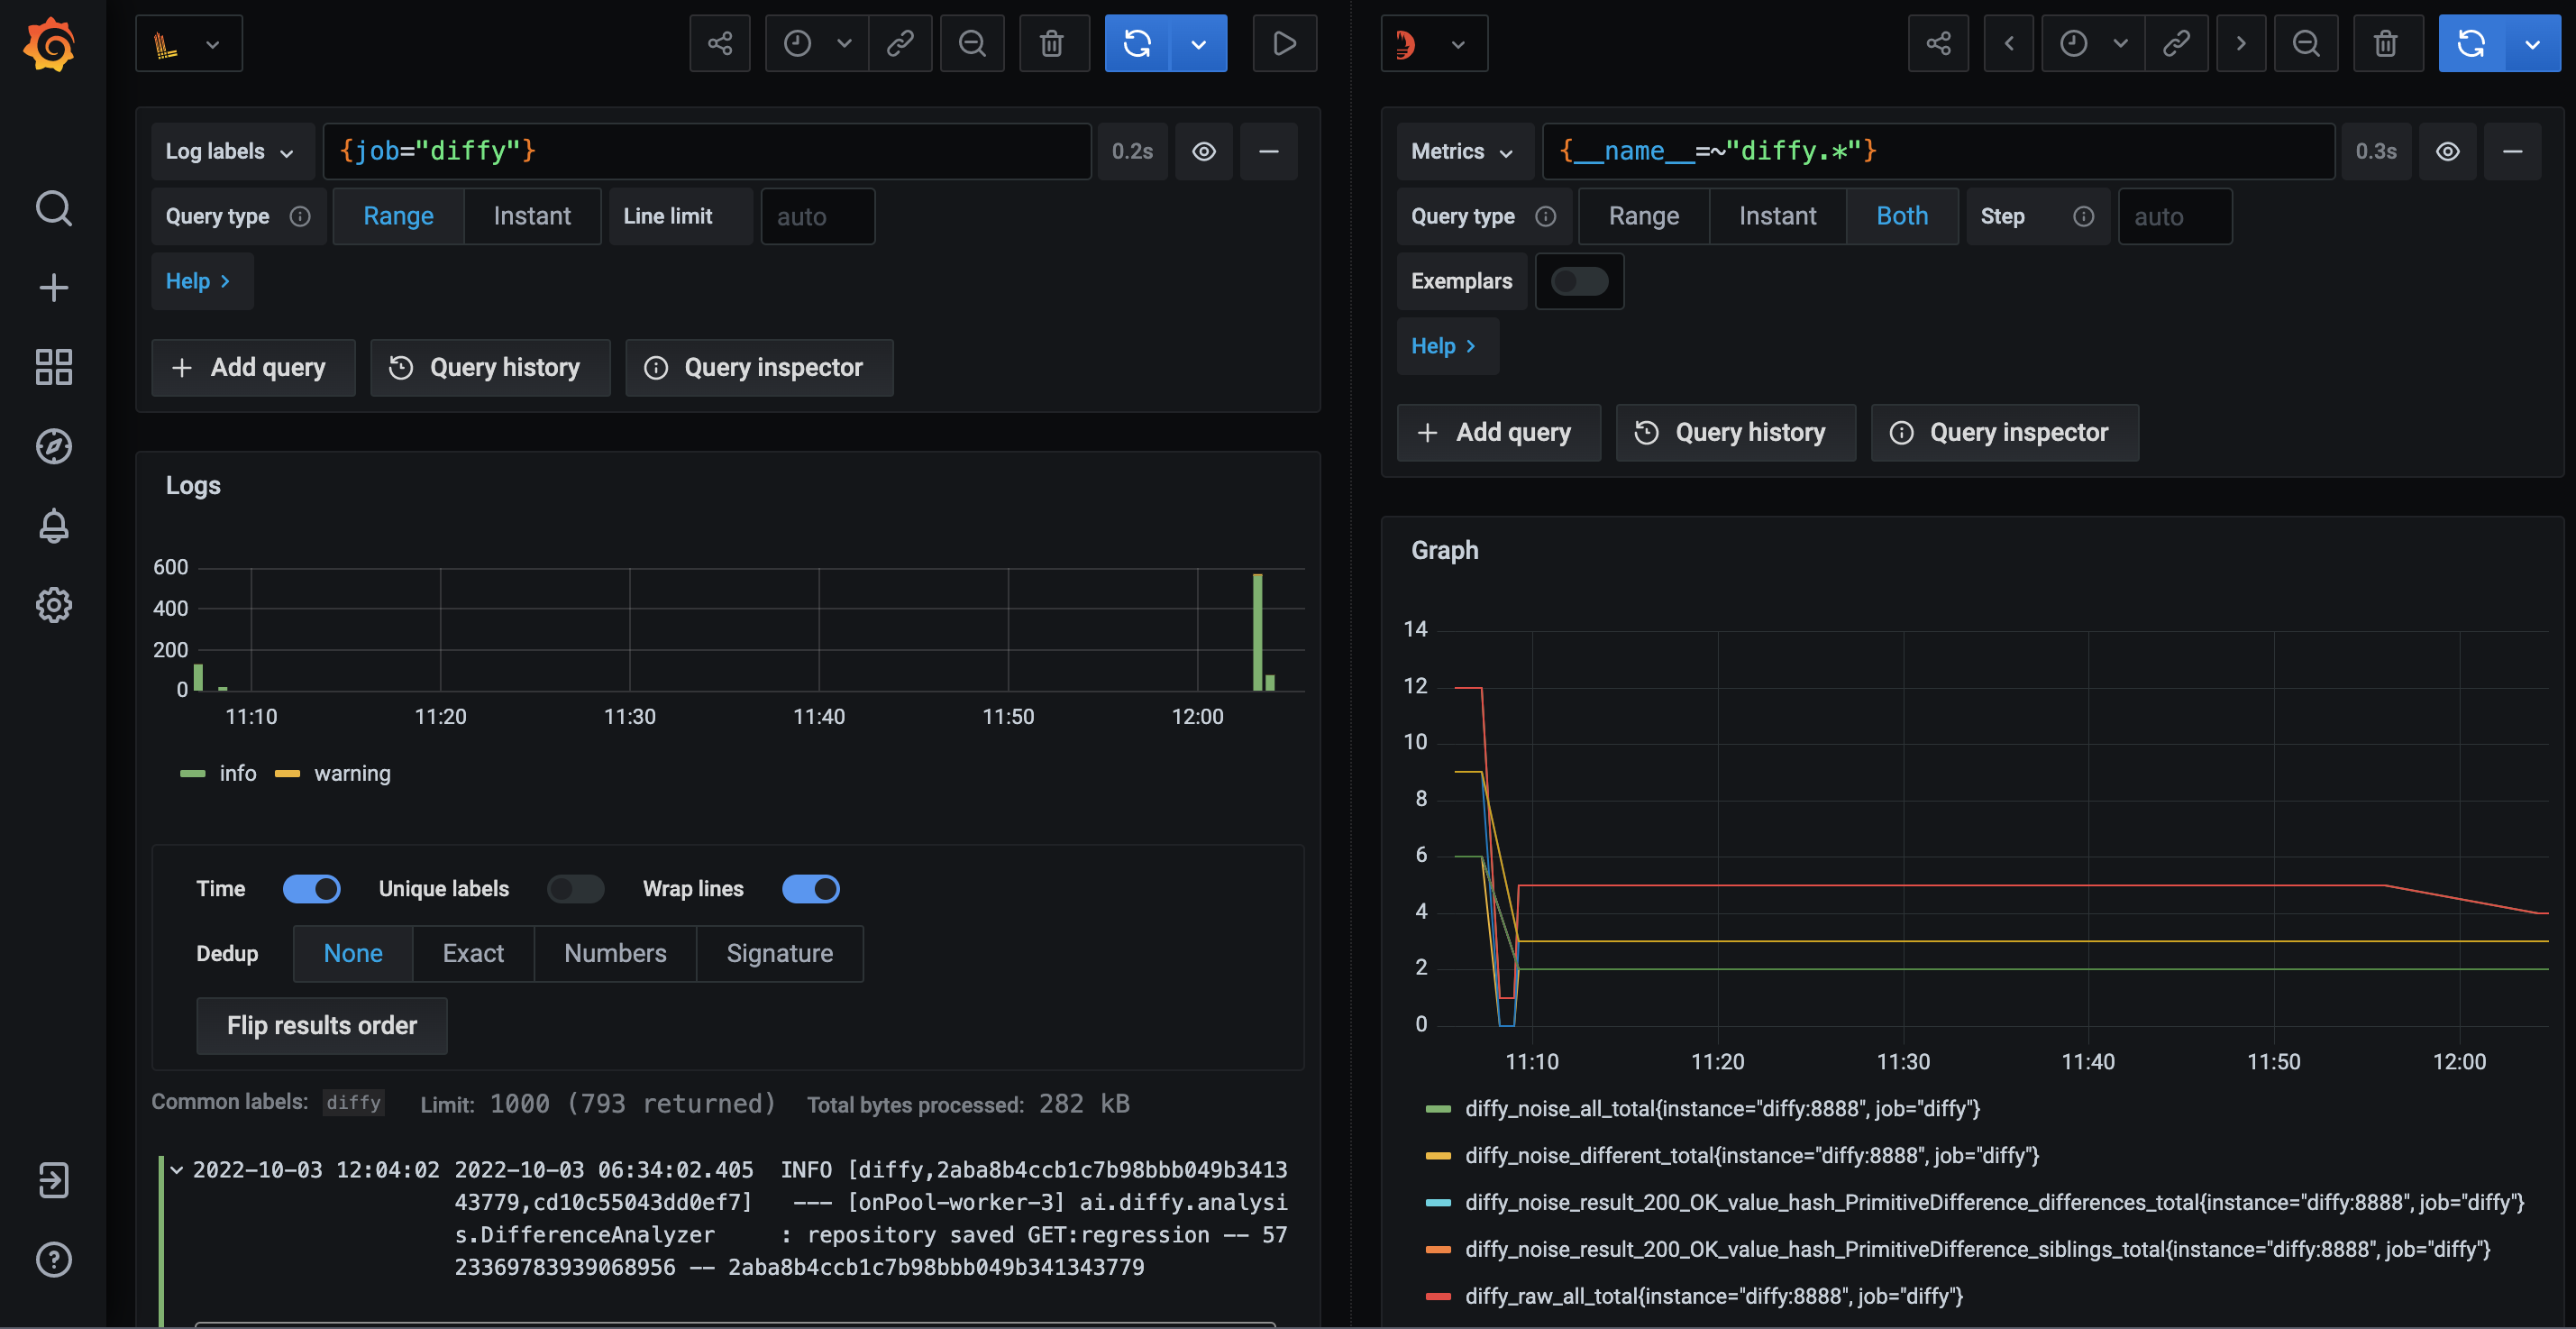
- Loki (logs)
You can also access Jaeger
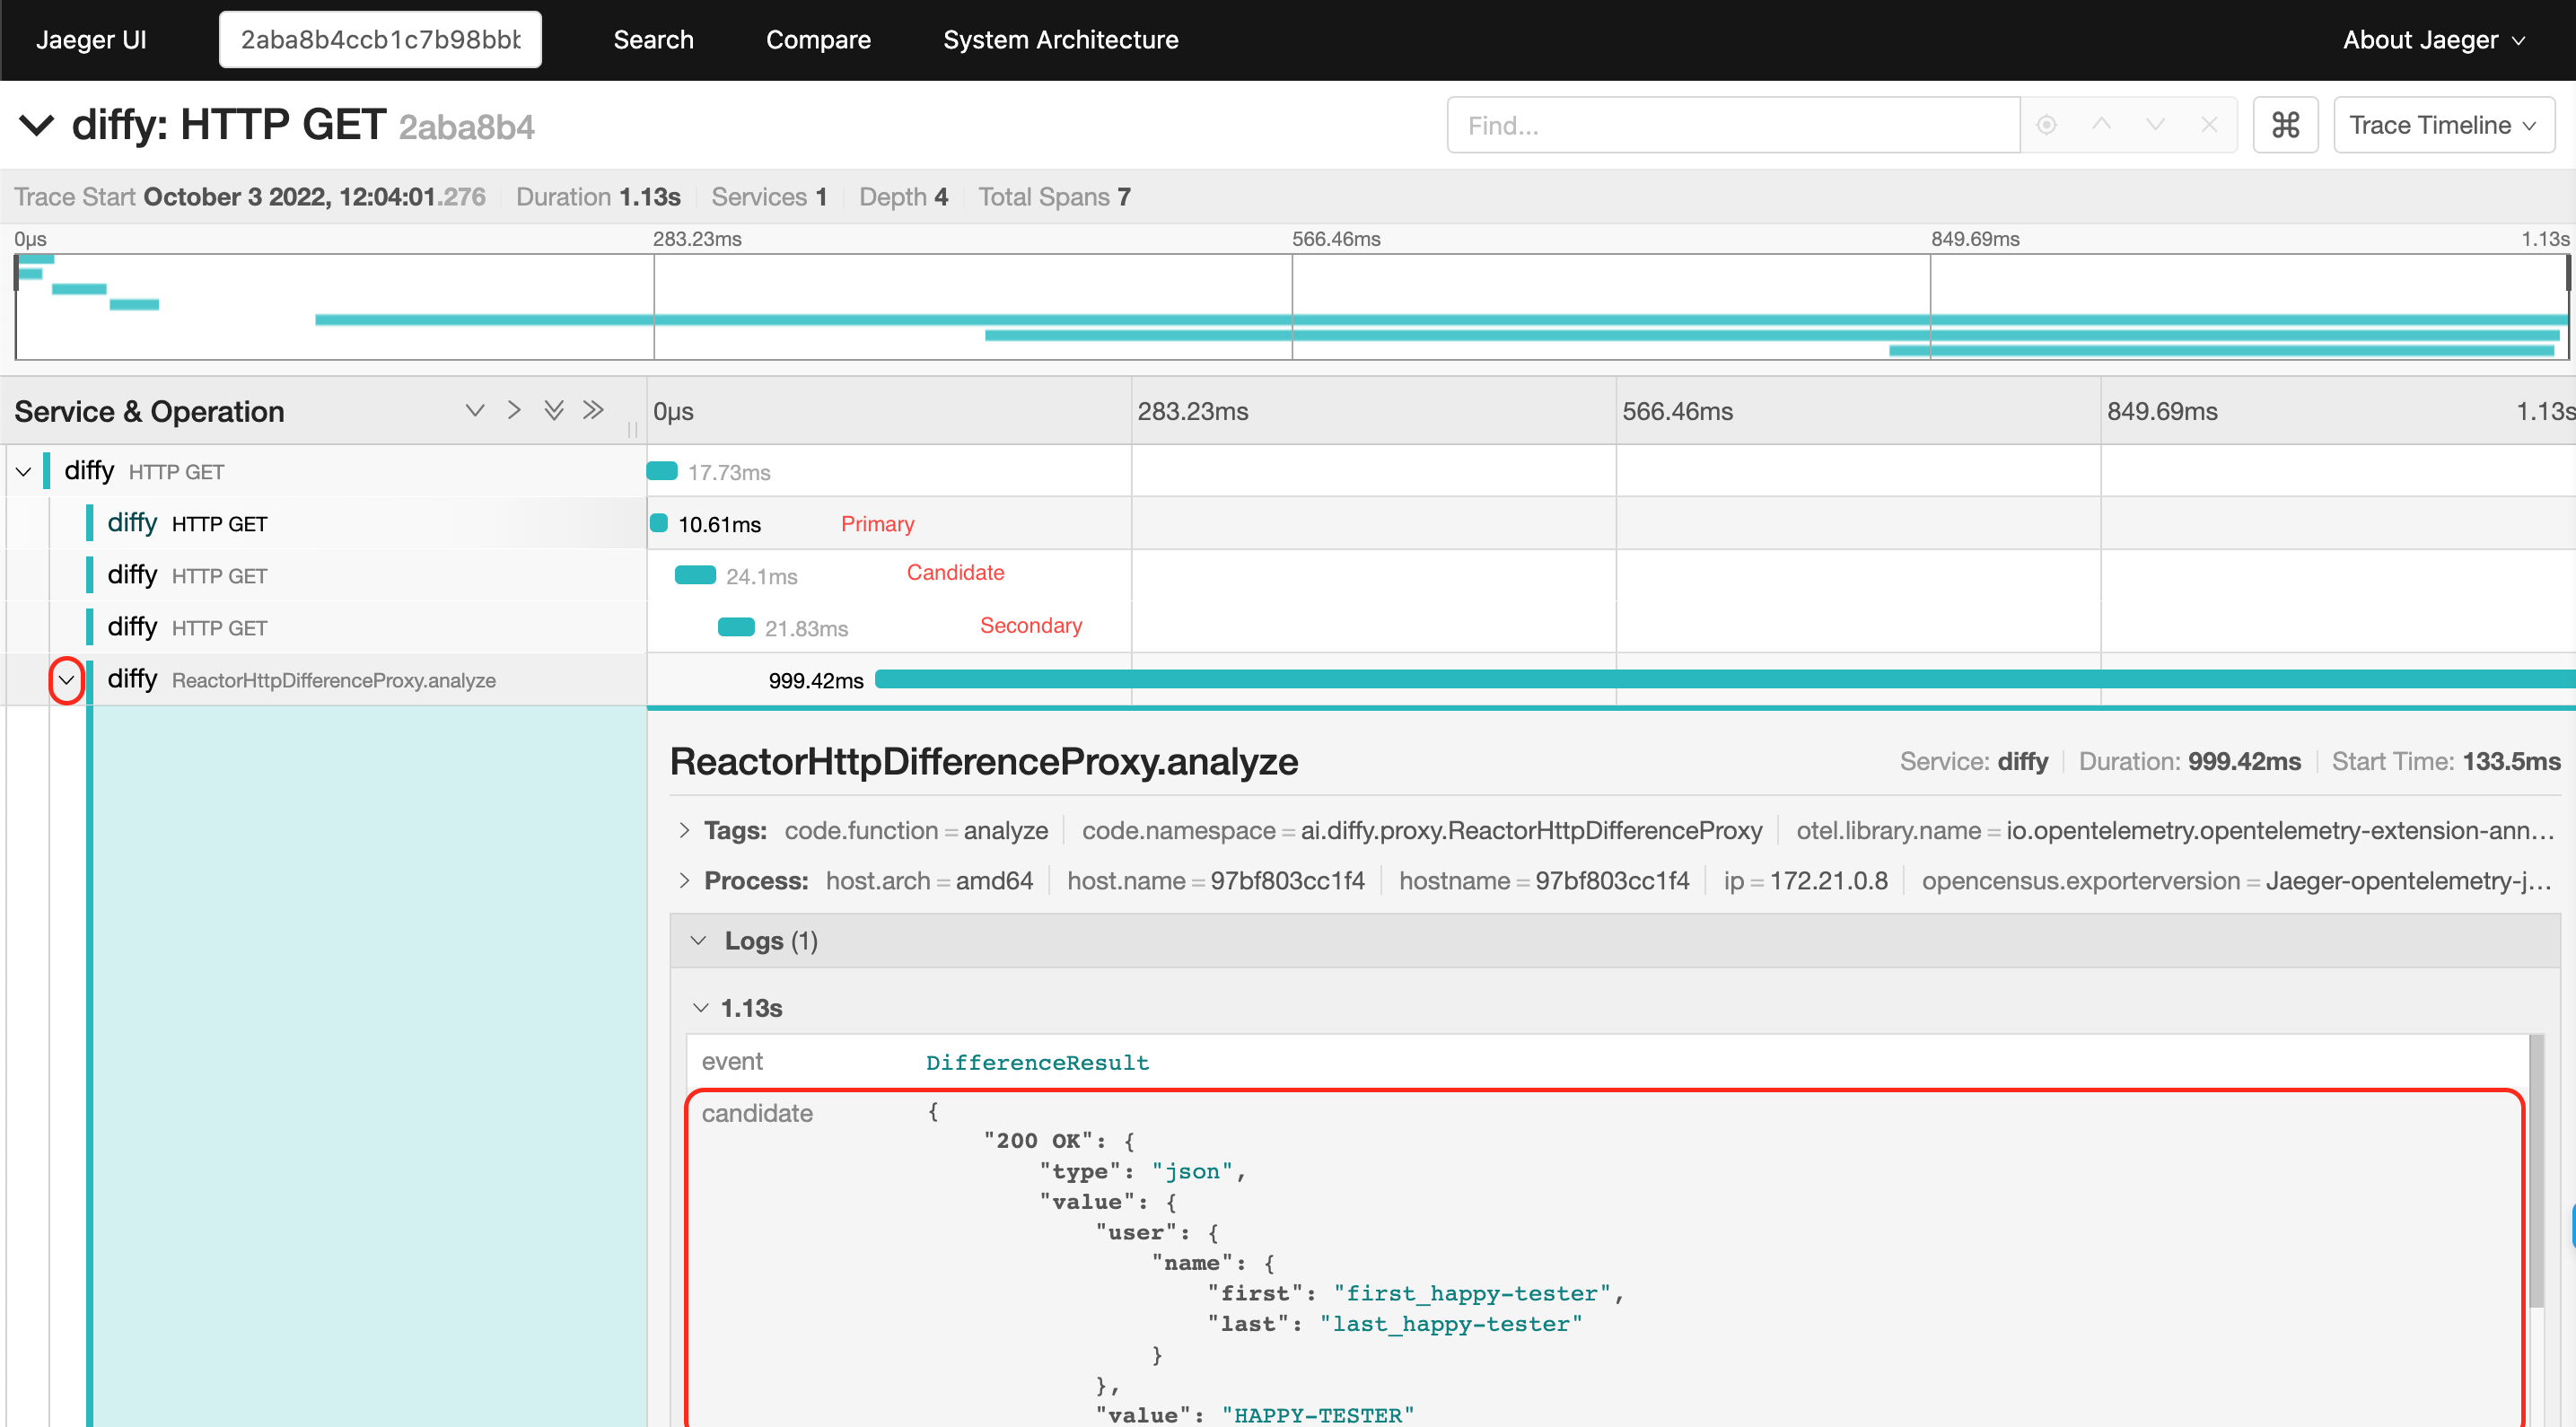 and Prometheus
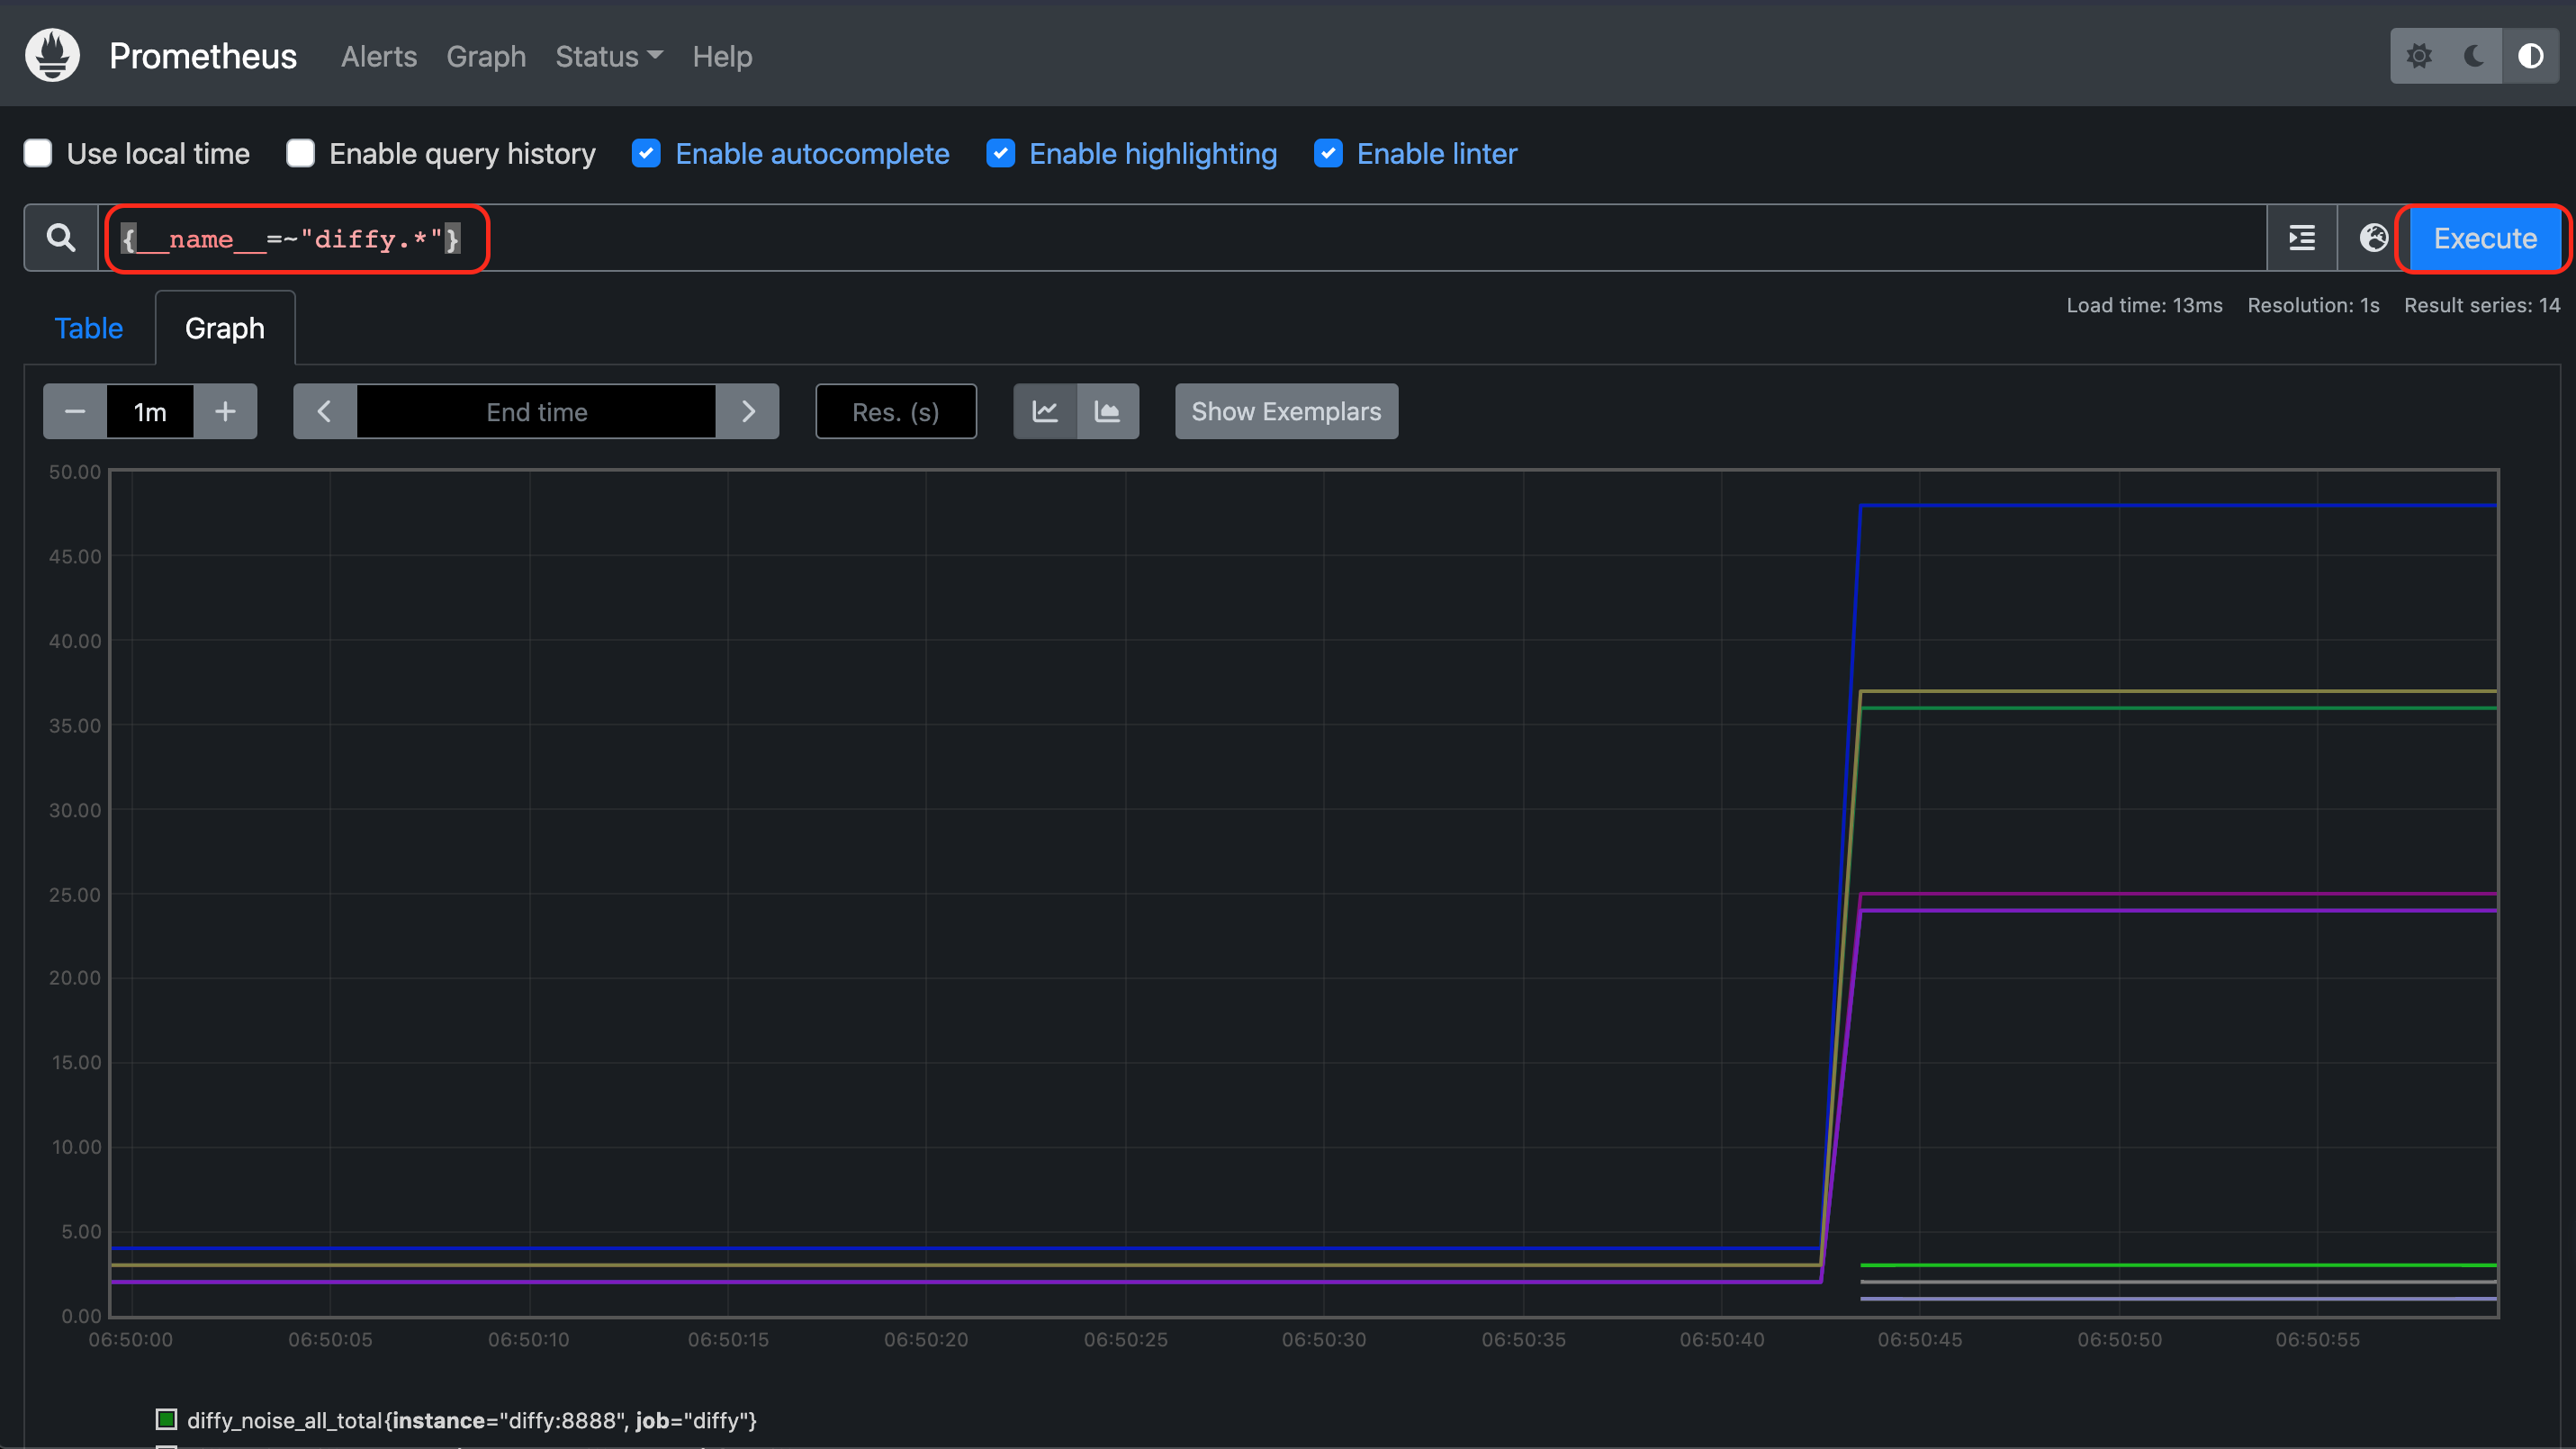
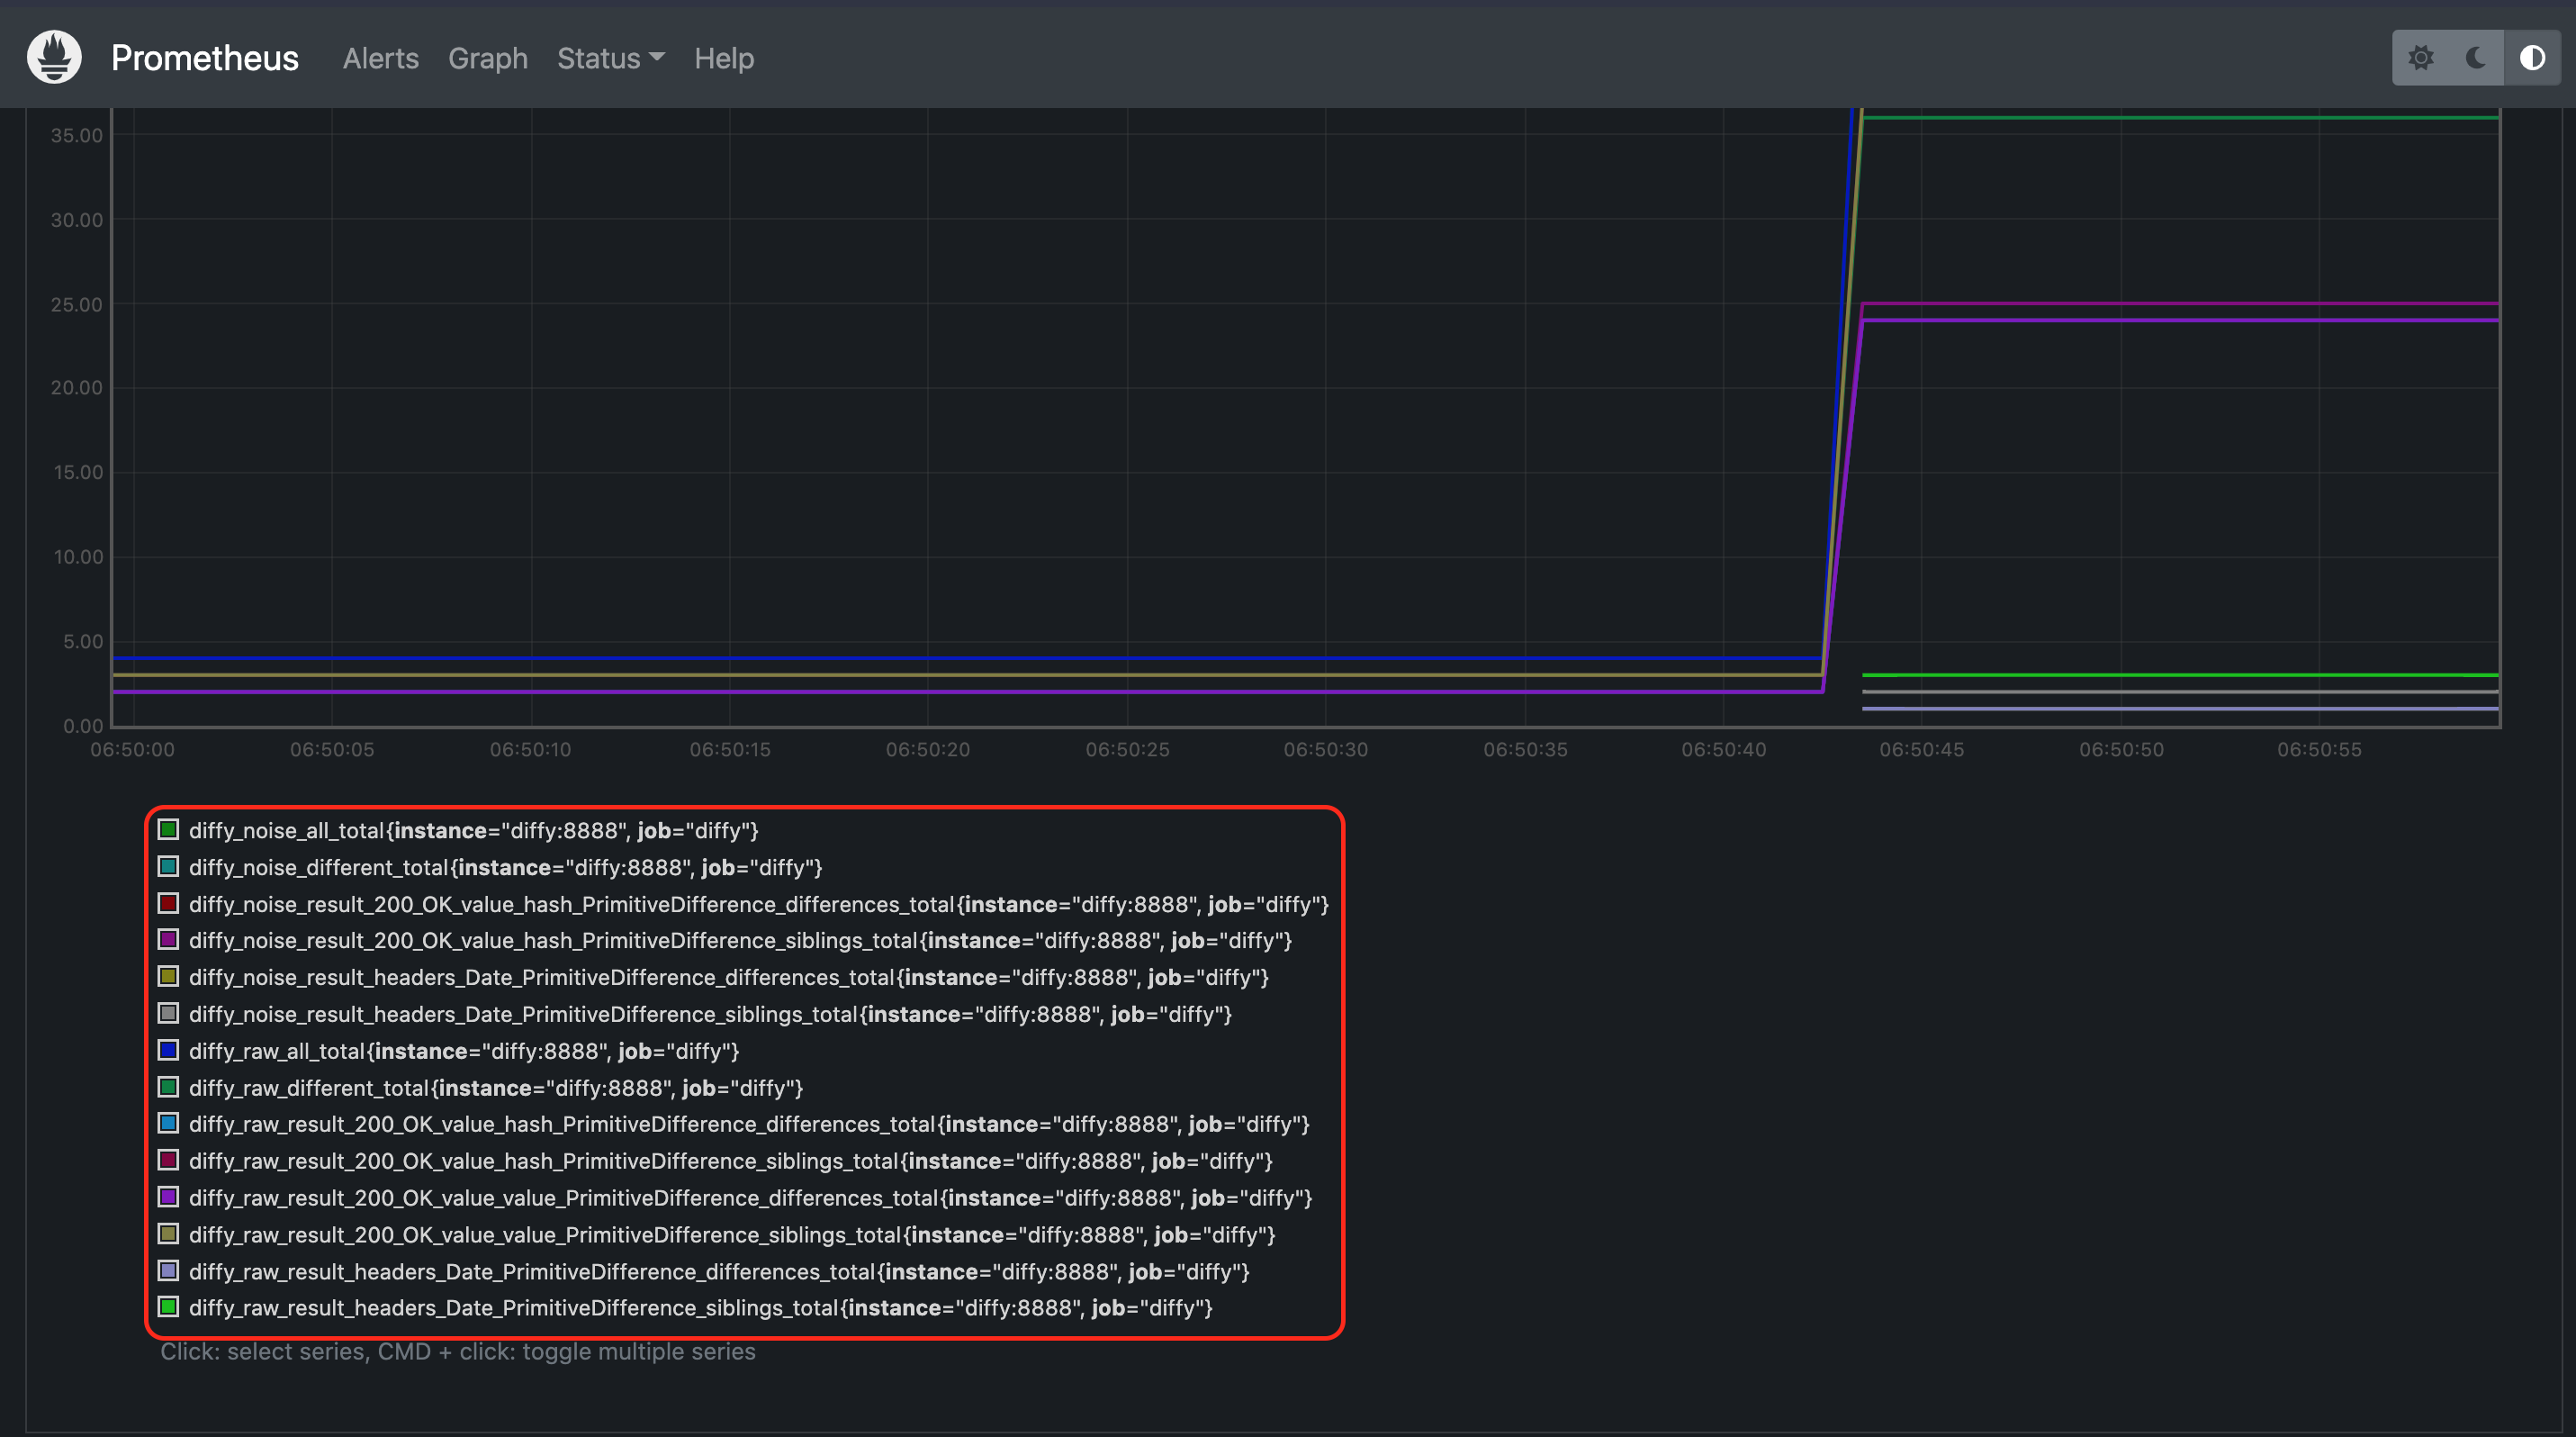 directly.
Credit
The above integration is largely based on examples shared on the OpenTelemetry Java Instrumentation website.